The Messy Metals March Higher
While we caught a nice low a little over a week ago, the rally off that low was quite promising as a standard structure . . . until today. But, as I was noting yesterday in my updates and in the trading room, something seemed “off” about the structure. Now, the best I can get is an ending diagonal for wave 5.
So, let’s look at the charts and see where we stand, as it is not simple, especially when we look at gold.
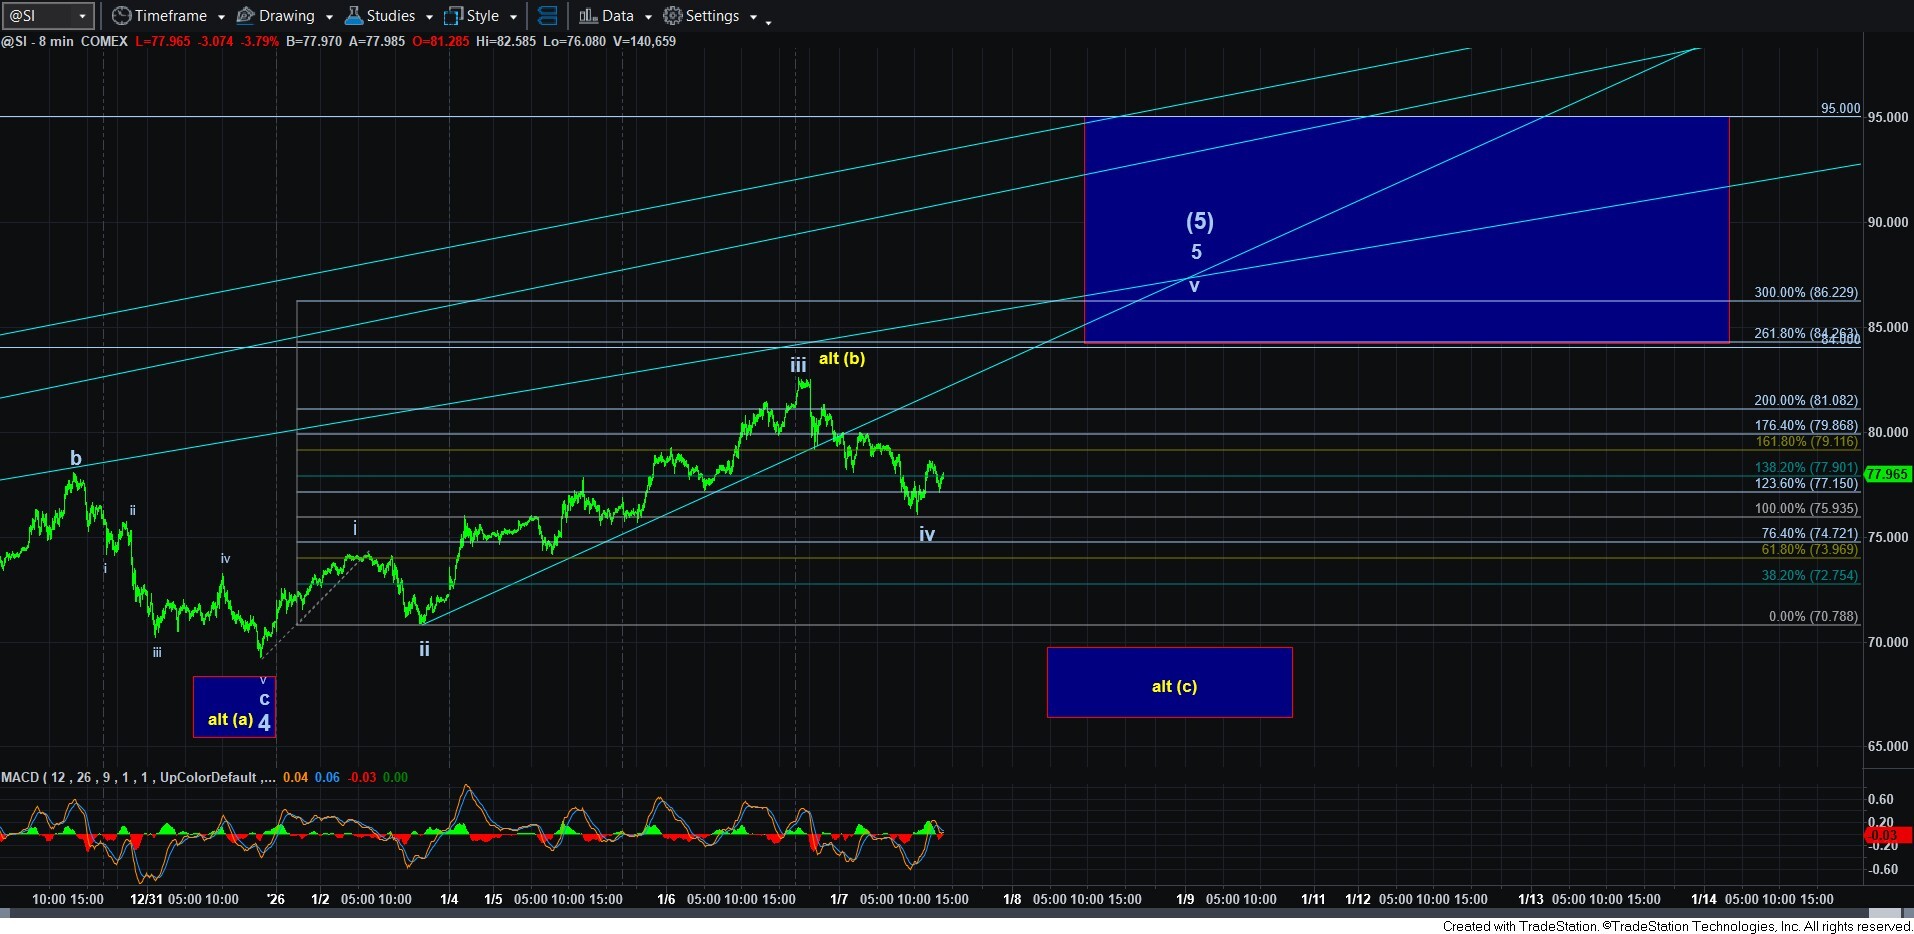
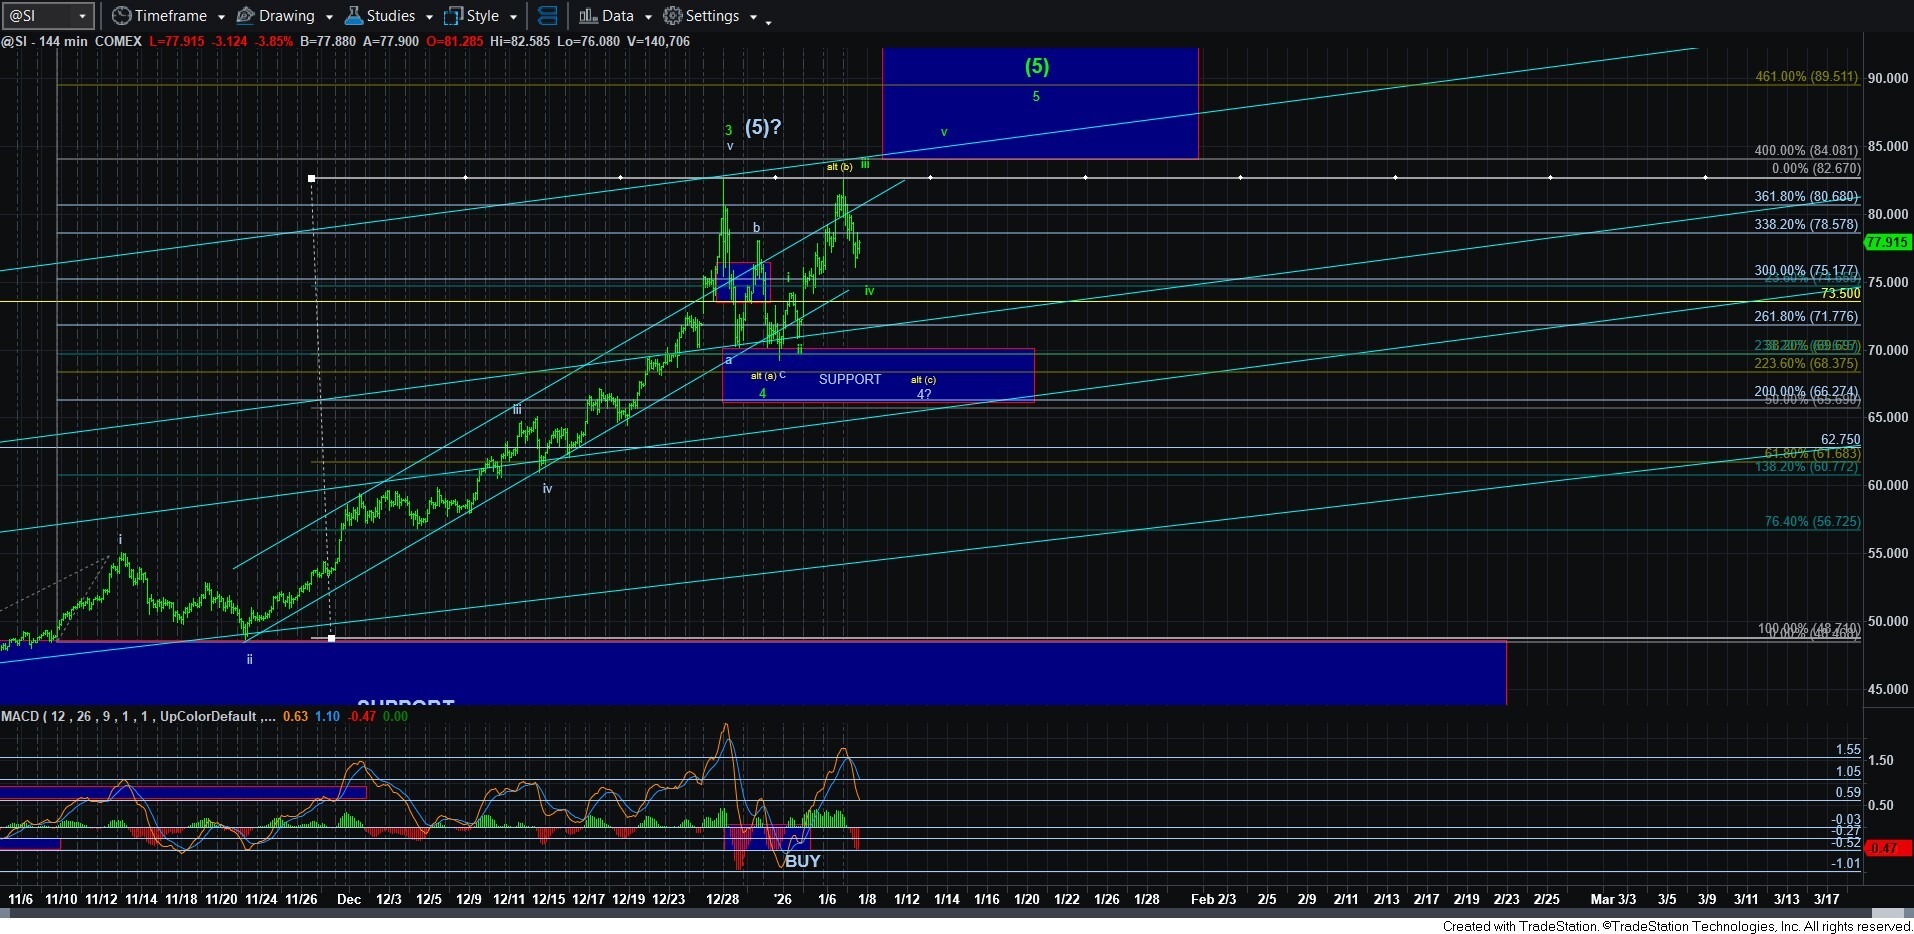
In silver, the alternative we were tracking thus far was presented in yellow, and would provide a c-wave decline to complete a larger wave 4 structure. However, since c-waves are typically standard 5-wave structures, the current decline today in silver is not a clean 5-wave decline. This is what led me to the ending diagonal scenario.
While today’s decline could be all of the wave iv, there is potential that this may only be the a-wave of iv. Unfortunately, since the rally off the low is a 3-wave structure (and it would be expected to be so under either scenario), it is indistinguishable as a b-wave rally in an ongoing wave iv from the a-wave of wave 5. So, I cannot say with a high degree of confidence that the 5th wave has indeed begun.
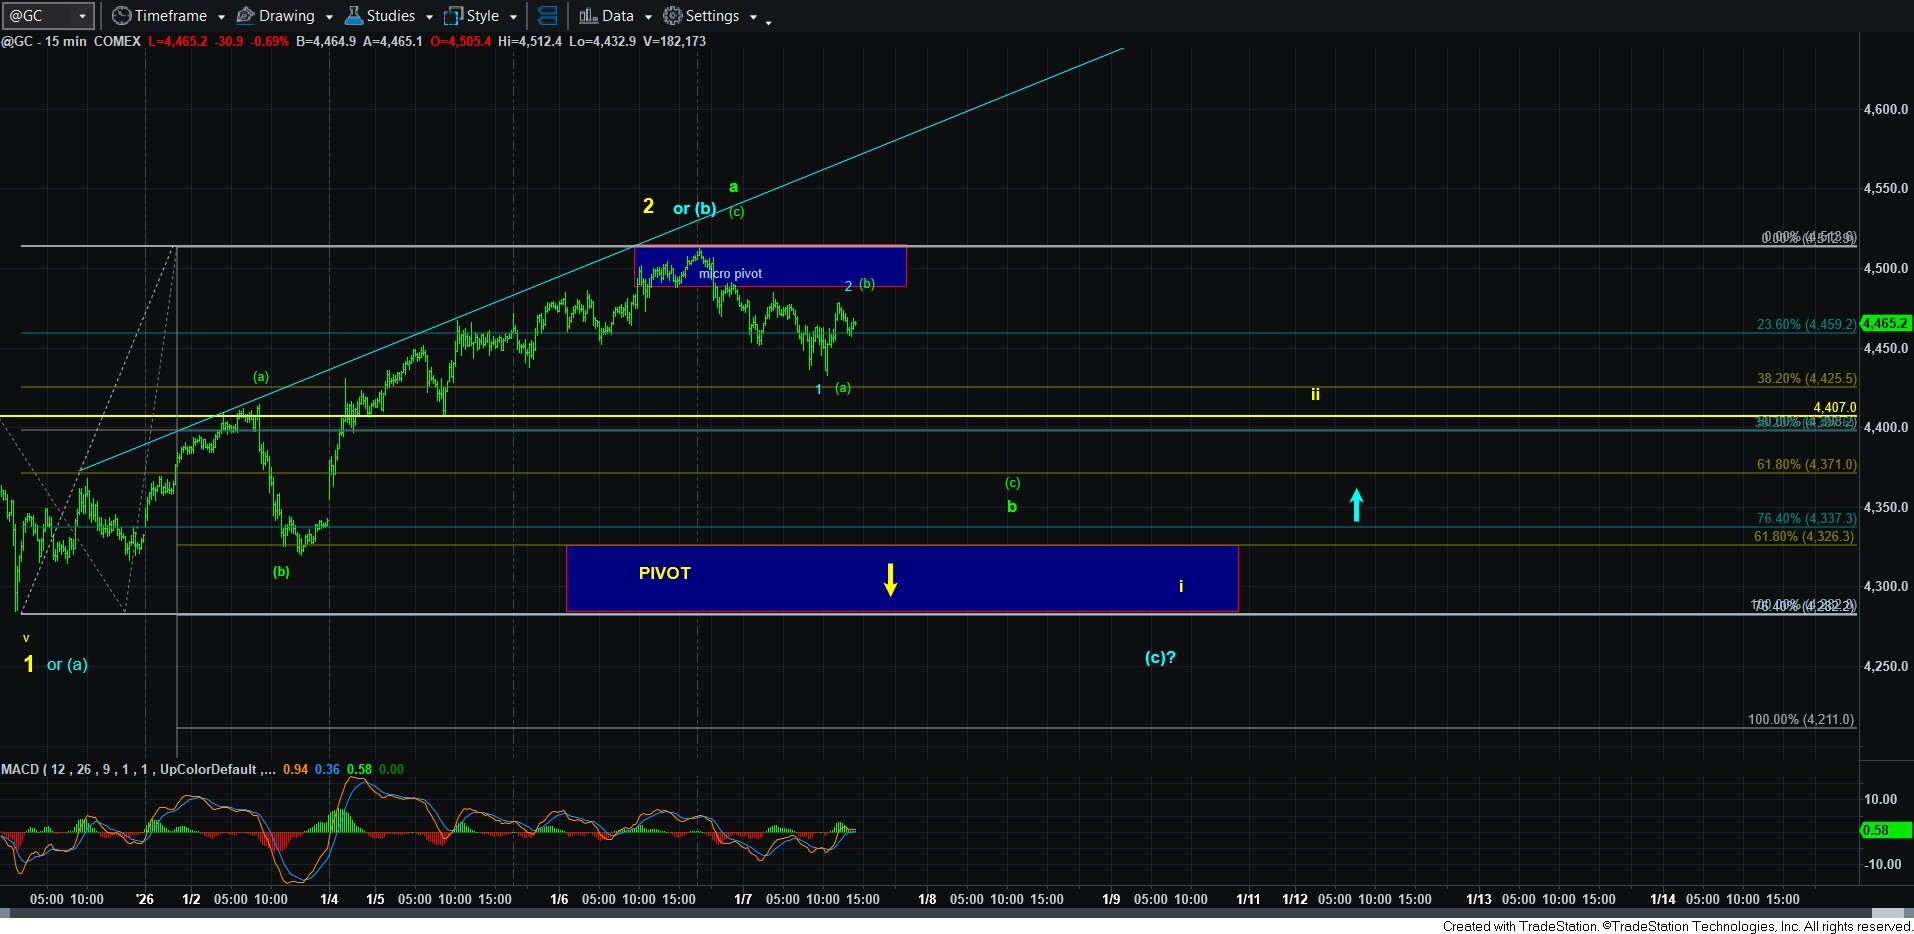
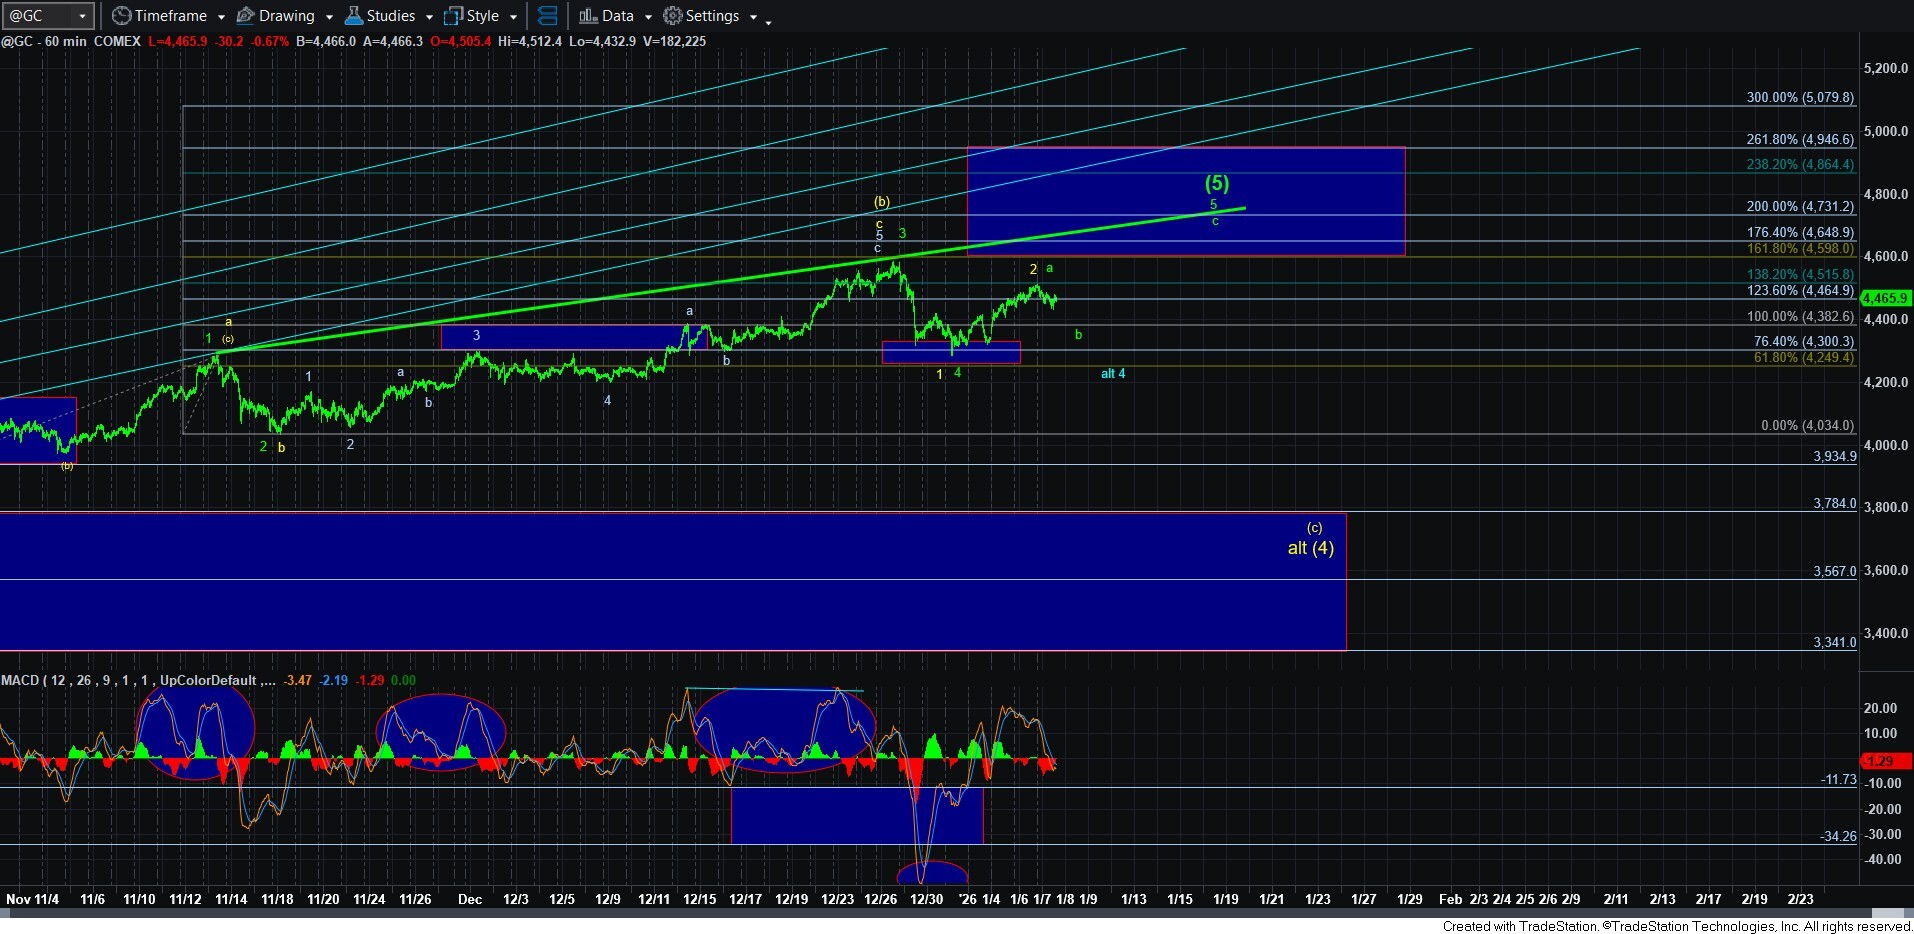
This is where I now turn to gold. And, the gold chart seems most likely to suggest this is a b-wave in wave 5. So, I am using that as my primary wave count right now, especially since the decline does not look to be a clear 5-wave decline.
Thus far, we have only pulled back to the .382 retracement region of the a-wave. While that may be all we get for the b-wave, the rally off today’s low looks relatively overlapping. However, rally also attained the .618 retracement of today’s decline. And, I am not yet seeing a clear 5-wave decline to suggest the c-wave down has begun. This leaves the door open in the micro count for either the (b) wave to continue higher (which leaves me with questions since we have already retraced .618 of today’s decline), or the rally for the bigger c-wave in wave 5 has begun with a leading diagonal (also not terribly reliable).
So, as with silver, I do not have any strong signals that suggest this b-wave has completed.
As far as the alternatives to the b-wave count, I have added a blue count which is akin to the yellow counts in both GDX and silver, which would suggest we have only begun a bigger (a)(b)(c) pullback in wave 4 in gold. Note that we have come up high enough now in gold to allow for a (c) wave decline and still be in the wave 4 in the diagonal, which would likely target the 4200-4280 region should we see a full (c) wave decline. But, as I said, this is going to have to be an alternative right now since I cannot say the decline is CLEARLY a 5-wave structure.
And, of course, the yellow count is still on the chart in gold, but I would say this is the lesser likely count, at least at this point in time. Also, please take note that the yellow count in gold is different than the ones in silver and GDX, as the gold yellow count calls for a much larger degree correction, which is not seeming as likely right now.
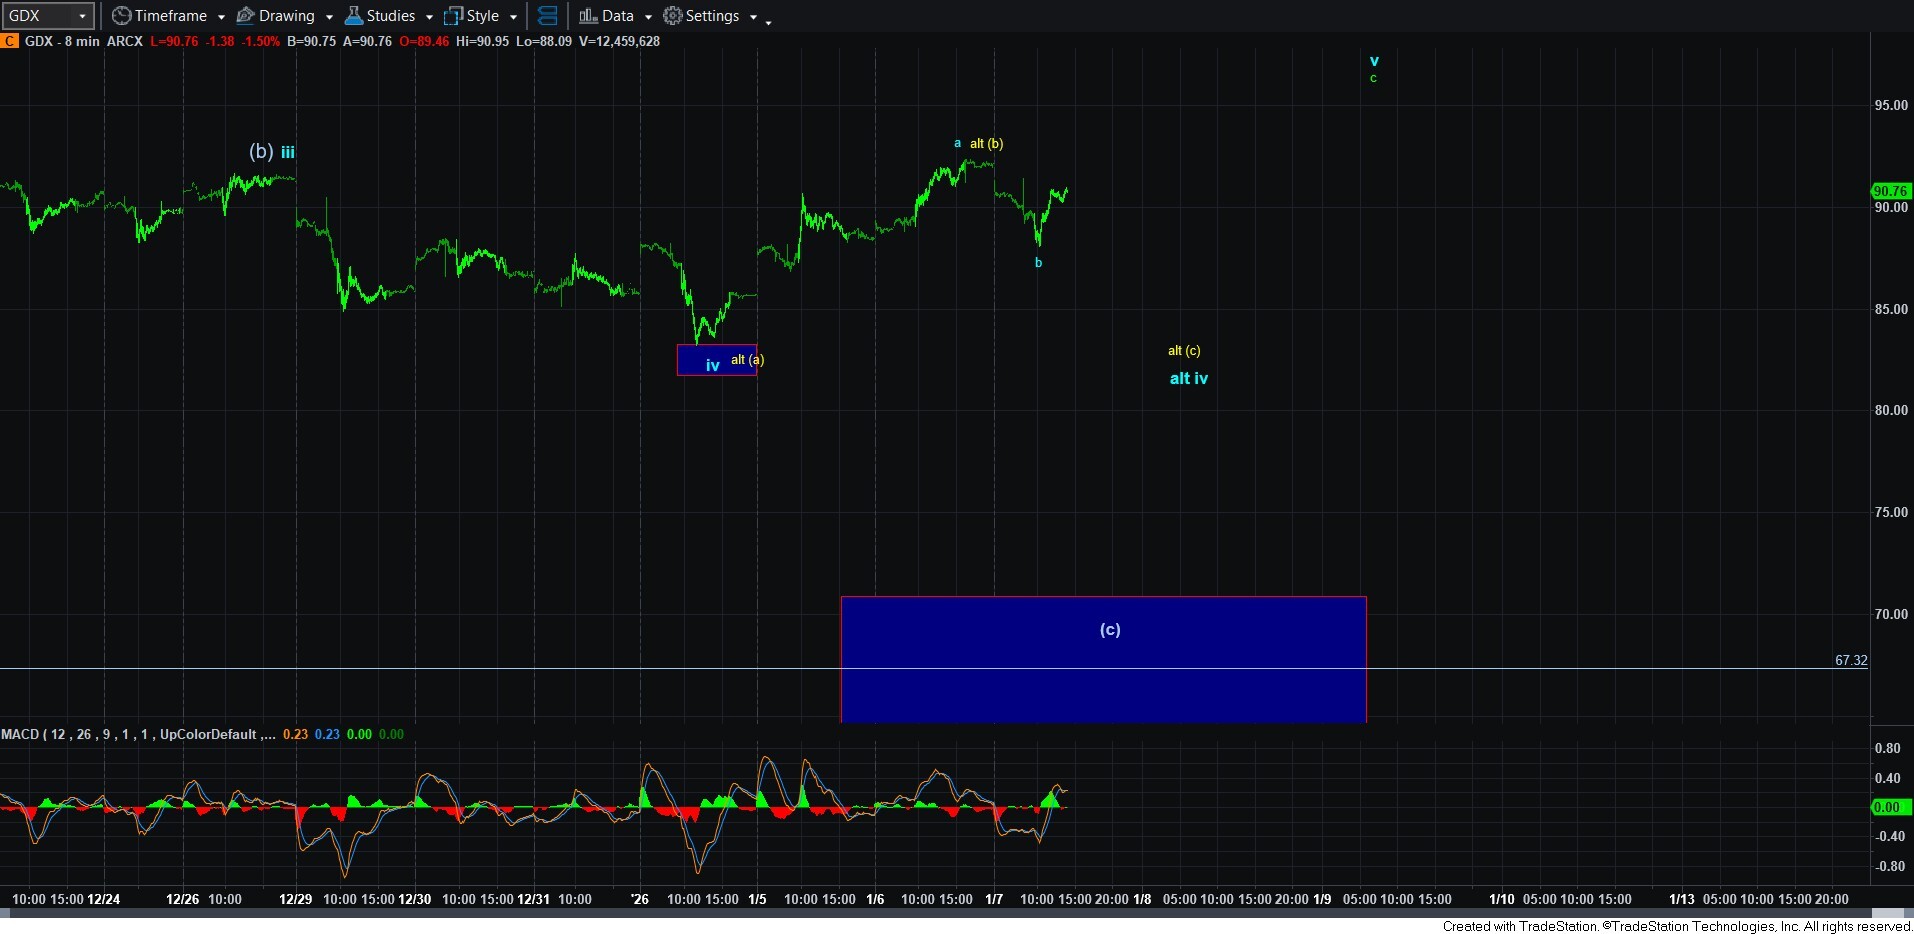
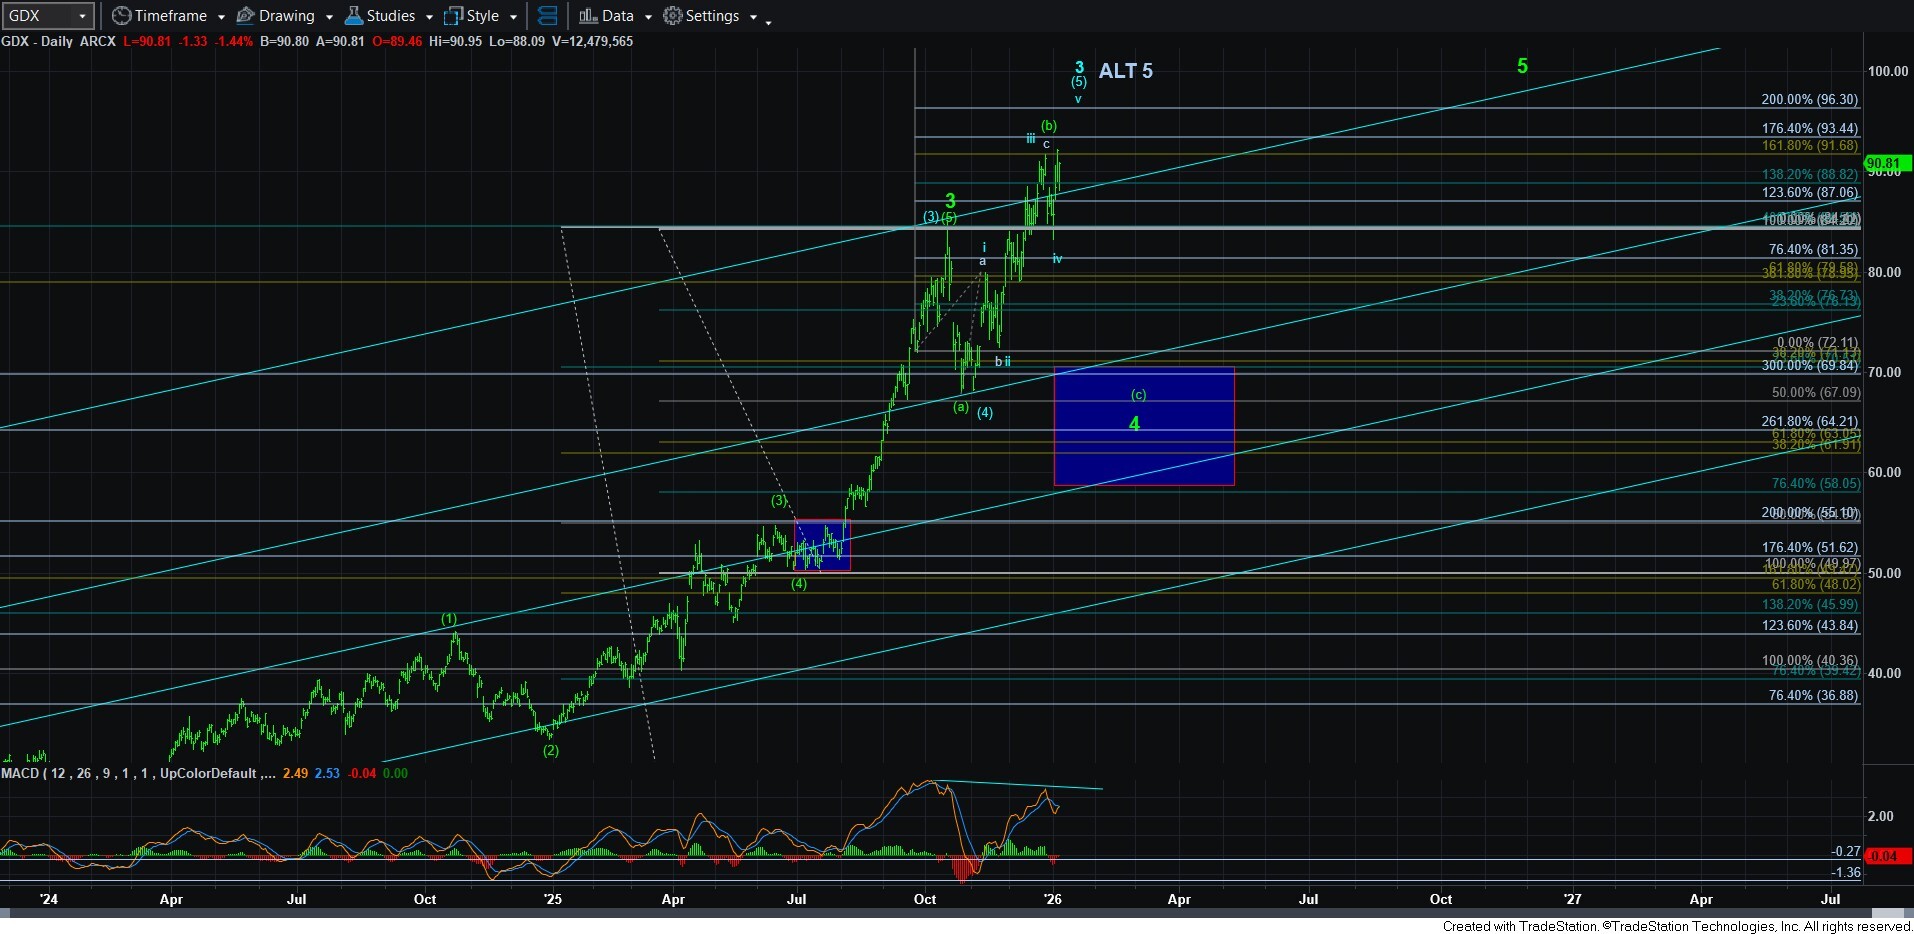
GDX pretty much mirrors gold. This can be a b-wave pullback which has already completed, and I can make an argument that we are trying to complete a 5-wave rally off today’s low for wave 1 of the c-wave higher to complete wave v.
But, I want to add a note of caution here. As I said in the trading room yesterday, I was already cashing in mining stocks near yesterday’s high, and I intend on cashing out a significant amount of my remaining holdings should we get that c-wave higher. Once we complete this ending diagonal in GDX with one more rally, it is likely that we will see a strong reversal, pointing us back down to the 70 region. Moreover, there is some potential for this rally in wave v in blue to complete all of the rally off the 2015 lows. So, I personally concluded I wanted to reduce my risk, and cash in the profits I have made since the 2015 lows. And, I can always get back in once we get that next drop to the 70 region, or lower.
So, in conclusion, I know this has become much more complex than we had wanted at this time. but it seems the market is trying to complete the various structures we have been tracking of late potentially sooner rather than later. Therefore, a nice (a)(b)(c) pullback to provide us with a higher probability and lower risk buying point for this last rally segment is looking a bit lesser likely right now. So, just please realize that if you are intending on playing this last segment on the charts it does come with a bit more risk as we are dealing with diagonals and I am not sure if the pullback is complete.
Of course, if the market does provide us with those (c) wave follow throughs in the coming days, then we will be presented with another high probability, low risk buying opportunity. But, if not, the market will likely be completing various diagonals sooner rather than later, and which will likely result in a very strong reversal being seen across the complex once completed.